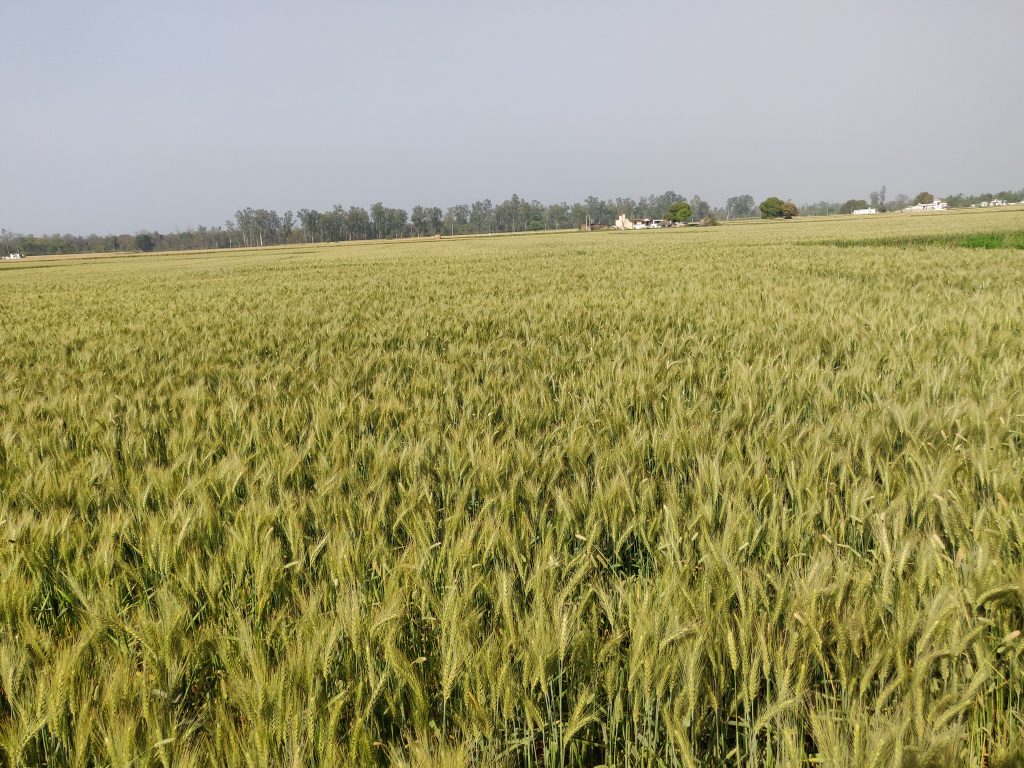
The C2 production cost of the crop went up Rs 601 per quintal from RMS 2017-18 to 2026-27

The minimum support price (MSP) of wheat has gone up by Rs 850 per quintal (nearly 49%) in India in the 10-year period from the rabi marketing season (RMS) 2017-18 to 2026-27. As per the data compiled by the Commission for Agricultural Costs and Prices (CACP), the MSP for wheat during RMS 2017-18 was Rs 1,735 per quintal, which has risen to Rs 2,585 per quintal.
According to the CACP data, the projected comprehensive cost of production (C2) of wheat for the RMS 2026-27 is Rs 1,804 per quintal, up by Rs 601 per quintal (nearly 50%) from Rs 1,203 per quintal during the RMS 2017-18.
According to the CACP, the cost of production (COP) of crops includes A2 (actual paid-out cost), A2+FL (actual paid-out cost plus imputed value of family labour), and C2 [comprehensive cost including the rental value of own land {net of land revenue and interest on the value of own fixed capital assets (excluding land)}]. The commission projects the COP for each crop using state-wise actual cost estimates.
For barley, the MSP and C2 production cost went up by Rs 740 per quintal (52.48%) and Rs 743 per quintal (53.06%) respectively during RMS 2026-27 from RMS 2017-18. The MSP for barley is Rs 2,150 per quintal and Rs 1,410 per quintal while the C2 cost is Rs 1,862 per quintal and Rs 1,119 per quintal during RMS 2026-27 and RMS 2017-18 respectively.
Among pulses, the support price and C2 cost of chana (gram) went up by Rs 1,475 per quintal (33.52%) and Rs 1,690 per quintal (53.06%) respectively during RMS 2026-27 from RMS 2017-18. The MSP for gram is Rs 5,875 per quintal and Rs 4,400 per quintal while the C2 cost is Rs 4,875 per quintal and Rs 3,185 per quintal during RMS 2026-27 and RMS 2017-18 respectively.
From RMS 2017-18 to RMS 2026-27, the MSP and C2 production cost of masur (lentil) rose 2,750 per quintal (64.7%) and Rs 1,883 per quintal (56.04%) respectively. The masur MSP is Rs 7,000 per quintal and Rs 4,250 per quintal while the C2 cost is Rs 5,243 per quintal and Rs 3,360 per quintal during RMS 2026-27 and RMS 2017-18 respectively.
Among oilseeds, during this 10-year period, the MSP of rapeseed-mustard and kusum (safflower) also increased by Rs 2,200 per quintal (55%) and Rs 2,440 per quintal (59.51%) respectively. For the RMS 2026-27, the MSP of rapeseed-mustard and kusum is Rs 6,200 per quintal and Rs 6,540 quintal while it was Rs 4,000 per quintal and Rs 4,100 during RMS 2017-18 respectively.
The projected comprehensive production cost of rapeseed-mustard and safflower in RMS 2026-27 is Rs 4,458 per quintal and Rs 5,738 quintal as against Rs 2,773 per quintal and Rs 3,952 per during RMS 2017-18 respectively. The C2 cost for rapeseed-mustard and safflower is higher by Rs 1,785 per quintal (64.37%) and Rs 1,786 per quintal (45.19%) respectively.
Difference in MSP of rabi crops between 2026-27 and 2017-18
| Crop | MSP for 2026-27 (Rs/Q) | MSP for 2017-18 (Rs/Q) | Increase (Rs/Q) | Percentage increase |
| Wheat | 2,585 | 1,735 | 850 | 48.99% |
| Barley | 2,150 | 1,410 | 740 | 52.48% |
| Gram | 5,875 | 4,400 | 1,475 | 33.52% |
| Lentil (Masur) | 7,000 | 4,250 | 2,750 | 64.7% |
| Rapeseed-mustard | 6,200 | 4,000 | 2,200 | 55% |
| Safflower | 6,540 | 4,100 | 2,440 | 59.51% |
Difference in C2 cost of production of rabi crops between 2026-27 and 2017-18
| Crop | Projected C2 cost for 2026-27 (Rs/Q) | Projected C2 cost for 2017-18 (Rs/Q) | Increase (Rs/Q) | Percentage increase |
| Wheat | 1,804 | 1,203 | 601 | 49.95% |
| Barley | 1,862 | 1,119 | 743 | 66.39% |
| Gram | 4,875 | 3,185 | 1,690 | 53.06% |
| Lentil (Masur) | 5,243 | 3,360 | 1,883 | 56.04% |
| Rapeseed-mustard | 4,558 | 2,773 | 1,785 | 64.37% |
| Safflower | 5,738 | 3,952 | 1,786 | 45.19% |
Source: CACP calculations
All-India projected cost of production of rabi crops and MSP for RMS 2017-28 and 2026-27
| Crop | Projected cost of production for RMS 2017-18 (Rs per quintal) | MSP for 2017-18 (Rs per quintal) | Projected cost of production for RMS 2026-27 (Rs per quintal) | MSP for 2026-27 (Rs per quintal) | ||||
| *A2 | **A2+FL | #C2 | *A2 | **A2+FL | #C2 | |||
| Wheat | 631 | 797 | 1,203 | 1,735 | 994 | 1,239 | 1,804 | 2,585 |
| Barley | 511 | 816 | 1,119 | 1,410 | 912 | 1,361 | 1,862 | 2,150 |
| Gram (Chana) | 1,799 | 2,241 | 3,185 | 4,400 | 2,886 | 3,699 | 4,875 | 5,875 |
| Lentil (Masur) | 1,674 | 2,174 | 3,360 | 4,250 | 2,825 | 3,705 | 5,243 | 7,000 |
| Rapeseed & mustard | 1,232 | 1,871 | 2,773 | 4,000 | 2,219 | 3,210 | 4,558 | 6,200 |
| Safflower | 2,076 | 3,049 | 3,952 | 4,100 | 3,052 | 4,360 | 5,738 | 6,540 |
Source: CACP calculations
* A2: Actual paid-out cost
** A2+FL: Actual paid-out cost plus imputed value of family labour
# C2: Comprehensive cost including the rental value of own land [net of land revenue and interest on the value of own fixed capital assets (excluding land)]
Note: All-India cost of production of a crop is the weighted average of CoPs of projected states
To read in Punjabi and Hindi, click below.
2017-18 ਤੋਂ 2026-27 ਤੱਕ ਹਾੜ੍ਹੀ ਦੀਆਂ ਫ਼ਸਲਾਂ ਦੀ ਪੈਦਾਵਾਰ ਲਾਗਤ, ਐਮ ਐਸ ਪੀ ਵਿੱਚ ਫਰਕ
2017-18 से 2026-27 तक रबी फ़सलों की उत्पादन लागत, एम एस पी में अंतर
